Posts

Showing posts from September, 2022

Adding XY Data and Geocoding

  This week in GIS5050 we were tasked with adding data to our maps through XY coordinates and through geocoding. I found this week to be a lot of fun. Maybe it's because the terminology and steps are becoming more familiar at this point. I ended up in the weeds for the geocoding lab because I just had to know where each school was located and why the ArcGIS "address locator" tool could not find them. My background is in early education so I find the variety of schools interesting. Notes to self: find out why charter schools are being called "combination" schools and if there is a directory of private schools. For ArcGIS, I plan to look up more information about ZIPLeft and ZIPRight means. Also, Ctrl+F was my best friend within the attribute table to find nearby reference points. The web map version of my geocoded map for public schools in Manatee County as of 28 September 2022 can be accessed here:  https://arcg.is/1HS5j4
Vector Analysis

Image
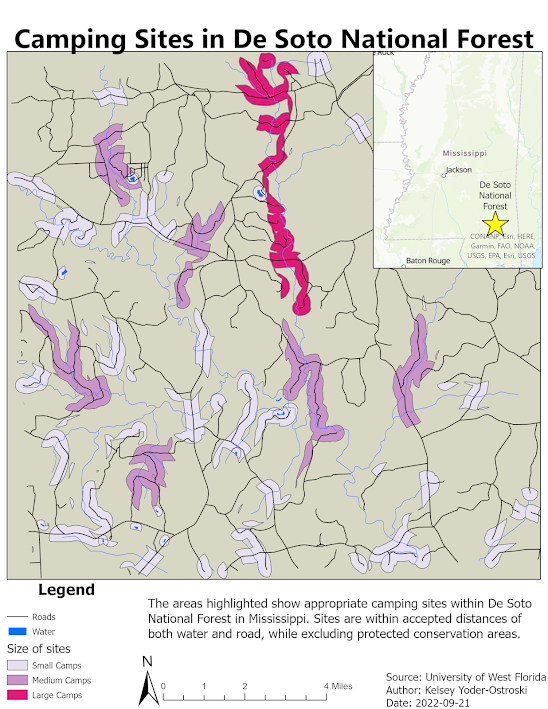
This week we learned how to a variety of analysis involving data resulting in the final product shown above. We were tasked with creating a map depicting suitable camping sites. The parameters were that the zones had to be within 150 meters of lakes, 500 meters from rivers, and 300 meters of park road while also excluding conservation areas.  For this map, I chose some of the standard colors for features: black for roads, blue for water. The title is on top and smaller text/features on the bottom. I put a star on De Soto National Forest for easier reference (I had no clue where it was before this lab). I chose light, medium, and dark pink to signify the various levels of site sizes. I was assuming the largest size was the most important so made that the most noticeable color. I add text to explain the purpose of the map and define the parameters of the chosen areas. There are several parts of the map I would like to edit. One is the background color; in my opinion it would look better

Data Collection and Projections

Image
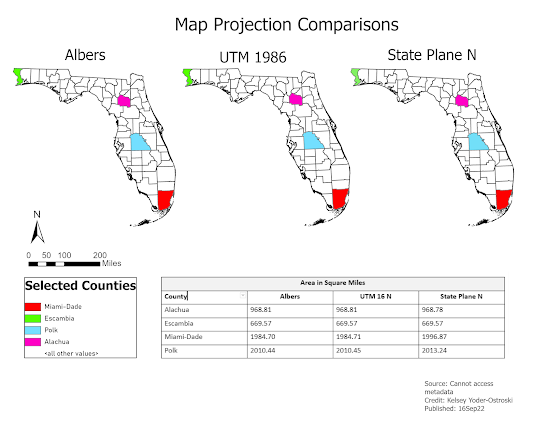
Click the following link to view this week's data collection via ArcGIS Field Maps: Click Here This week's lab was a massive project and, unfortunately, I do not have an accurate map to show for it. As you can see above, all three maps are using the same projection (and, thus, no comparison can be made). This week has been challenging. For the past few weeks, I had been completing schoolwork on a laptop old enough to go to school itself. I am fortunate enough to be able to upgrade to a more up-to-date system. However, I think of the students who can not afford to spend money out of pocket or have access to on-campus computer labs.  Again, my map is not accurate in the least. For reasons I have not yet discovered, my projections were lost during the transitioning to a new computer. The map is also... visually unappealing. It has the basic elements (minus the metadata that I can not access) but it has no personalization. I need to walk away for awhile and maybe tomorrow try again

Cartography

Image
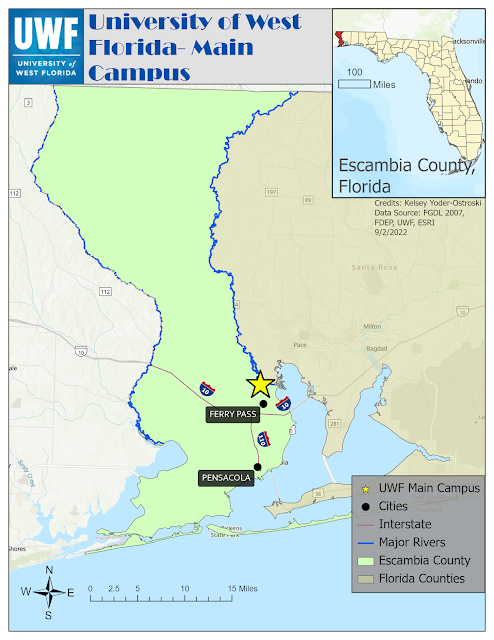
    As for the process of creating the map, I found this week challenging! Like last week, I found myself focusing on orienting myself to a wide range of new concepts (and stopping to cry a couple of times). Control+F became my very good friend. At about halfway through the lab, I lost half my shape files. I'm not sure how it happened but I just copied the missing ones from the repository and continued chugging along.  I am satisfied with the readability of the final product. However, I would like to continue improving stylistically. I feel that this may be an area where I will excel as I find graphic design fulfilling. I love the design of the provided examples. Note to self: read the entire lab before starting!