Vector Analysis
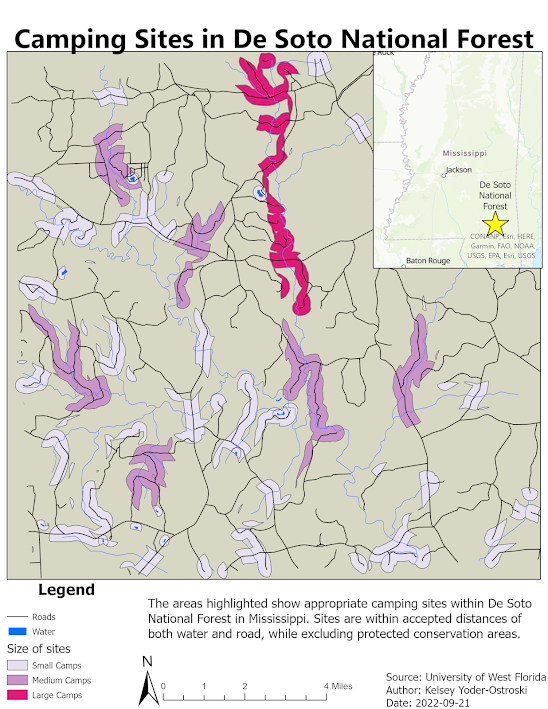
This week we learned how to a variety of analysis involving data resulting in the final product shown above. We were tasked with creating a map depicting suitable camping sites. The parameters were that the zones had to be within 150 meters of lakes, 500 meters from rivers, and 300 meters of park road while also excluding conservation areas.
For this map, I chose some of the standard colors for features: black for roads, blue for water. The title is on top and smaller text/features on the bottom. I put a star on De Soto National Forest for easier reference (I had no clue where it was before this lab). I chose light, medium, and dark pink to signify the various levels of site sizes. I was assuming the largest size was the most important so made that the most noticeable color. I add text to explain the purpose of the map and define the parameters of the chosen areas.
There are several parts of the map I would like to edit. One is the background color; in my opinion it would look better as the same shade of green as the insert map (aka the standard forest color). Next I would like to zoom out on my map so that one of the camp sites is not covered by the insert.
I had a chance to look at some other student's blogs and saw a round insert map that I think looks amazing.


Comments
Post a Comment