Posts

Showing posts from October, 2022

Land Use/Land Cover Classification and Accuracy Assessment

Image
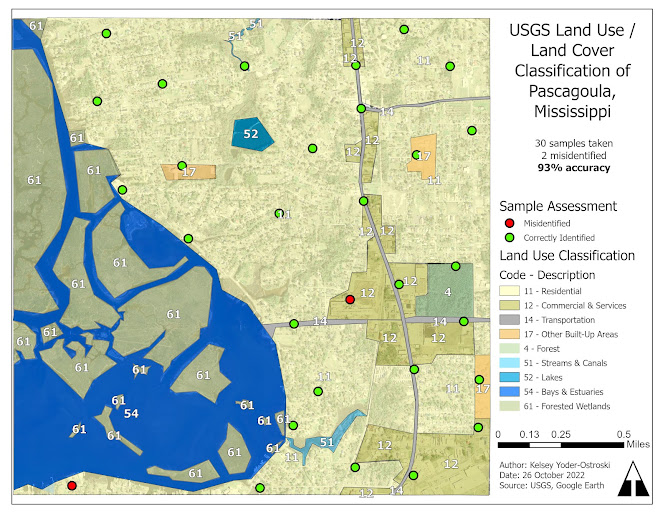
  A map depicting areas of land use/ land cover based  on USGS Level II classification system for the Pascagoula, MS area. This week for GIS4035, we were tasked with using aerial imagery to manually classify different areas of land use/land cover (LULC) based on the United States Geological Survey (USGS). Afterward, we had to assess the accuracy of our analysis by creating 30 sample points that were cross-referenced with in situ data through Google Maps. Finally, we created a map document to demonstrate our results. For identifying features, I relayed a great deal of association. Most of the map extent is residential with recognizable single-home neighborhoods. Retail and other businesses tend to run along major roads and, of course, that great, big blue stuff is water. However, using this strategy also caused my two errors. The red point on the bottom west corner was actually a small cemetery located within a neighborhood. The second misidentification belongs to a very large warehouse

Visual Interpretation

Image
  Two maps created during Module 1 of GIS4035. Each one depicts different attributes when visually interpreting aerial photos. For this week in GIS4035, we were introduced to the basic concepts of visually identifying features in a vertical photograph. The shared language of visual analysis was emphasized. As visual creatures, we automatically "know" that an object is a tree or a forest, but as analysts, it is important to have a vocabulary to accurately describe and categorize objects and phenomena.

Bobwhite-Manatee Transmission Line Analysis

Image
For our final project in GIS5050, we were tasked with creating an after action report for Florida Power and Light's Bobwhite-Manatee transmission line. That report can be viewed in the links below. Click here to view Powerpoint presentation. Click here to listen to this presentation. Click here for a transcript of the above presentation.

Georeferencing, Editing, & 3D

Image
  A map depicting the location of a protected eagle's nest located on the University of West Florida campus. This week in GIS5050, we were tasked with creating a new map with combined, georeferenced raster and LIDAR images. Afterward, we were also asked to make our map 3D. We learned to georeference raster files by creating control points onto a topologically correct map, looking for familiar landmarks, and analyzing RSM errors for poorly marked control points. It was satisfying watching the raster become more accurate as each control point was added. We experimented with editing tools by adding a new building and road to the campus. Let's say I have a new respect for the process of creating accurate polygons. Who knew drawing "simple" shapes could be so hard! After creating a multi-ring buffer for our EagleNest point, we were finally instructed with creating a 3D version of our map. We combined our georeferenced raster with a LIDAR file, creating a new "ground&q