Posts

Welcome to Applications in GIS

Image
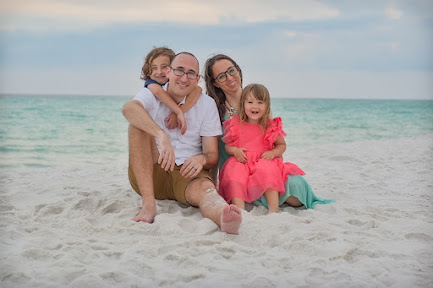
My name is Kelsey Yoder-Ostroski and I am a new(er) student in the world of GIS. This is my sixth class in UWF's GIS Admin graduate program as a full-time student. At the moment I am a caregiver to our kids but I also do volunteer work with a nonprofit providing support to local parents. We are a military family; we have lived in the Navarre area for 3.5 years and are preparing to move to Germany this fall. I'm not ready for the cold! I am originally from Texas so I love the heat, but we can't wait to see everything Germany and its neighbors have to offer.  In my free time, I enjoy learning German, baking (mostly breads), or doing home improvement projects. I have a weakness for cookies and power tools.  I am pursuing a master's in GIS business administration because I love how applicable and versatile it is. It literally encompasses every topic on Earth from the land to its resources and to all of history. I'm not 100% sure what I will do after graduating but I am ...

Working with Geometries in Python

Image
  For this week's assignment, we were tasked with exporting select attributes of a feature class from the shapefile to a TXT file. We needed the X and Y coordinates of the feature's vertices as well as the corresponding object (point) ID, vertex ID, and name. A flowchart and pseudocode were first produced to aid in problem-solving. I generalized the tasks in the flowchart so I could focus more on the final code's structure. Then, I added more details (such as variable names) in the pseudocode. My biggest obstacles included using the wrong cursor type for the desired task (which I blame on late-night coding), small syntactical errors such as open parenthesis, and not realizing that the write.method inputs referred to the cursor parameters and not to the attributes in the shapefile.  As you can see from the output, there is an enormous amount of data being extracted from the feature. Python (and coding languages) provide methods for handling the vast amount of information tha...

Exploring & Manipulating Data in Python

Image
  We continued expanding our knowledge of Python this week by incorporating two new functions: Describe() and ListFeatureClasses(). These allow us to explore data, which can then be manipulated using cursors and dictionaries. We were tasked with a multi-step project to: (1) copy a global database into a new database, (2) print the cities classified as county seats and the corresponding population, (3) and create a dictionary containing this information. A flowchart, as seen below, helps elucidate each step of the process. The output of the script can be seen below. Adding messages before and after each task aids in readability.

Geoprocessing with Python

Image
Modeling is a valuable tool for creating a visual guide for sequencing geoprocessing tasks. Laying out step-by-step visuals aids in problem-solving, creates solid code, and results in tools that can help other GIS analysts.  ArcGIS Pro incorporates visualization with ModelBuilder. Even though the geoprocessing sequence can be elaborate, using ModelBuilder provides a clean, organized workspace to visualize the entire process. A sample ModleBuilder from Esri We built upon our geoprocessing knowledge by writing our own Python scripts. For our assignment, we needed to create a script that would add XY coordinate points to a point shapefile of Austin area hospitals. Then the updated file needed a 1000 meter buffer with dissolve. Finally, we need the script to return a print message confirming each function was executed. The final outputs are pictured below.    Creating a flowchart in ModelBuilder was a helpful way to visualize each step. The biggest challenge I had this week w...

Handling Debugging in Python

Image
  This week has left me feeling much more confident in my ability to code. We learned about common error messages and how to handle them through a process called debugging. We were given three pre-made scripts and were tasked with finding and debugging the errors.  The first script included simple syntax errors, which are errors in the convention of the coding language. These commonly include misspellings, incorrect upper or lowercase usage, missing punctuation, or incorrect indentation. Below is a screenshot of the script output after correcting for syntax. The next script was much more challenging. There were multiple syntax errors but, after these were corrected, the script returned with an exception error. Exception errors occur when the script is able to run correctly but something "unexpected" happens. These can be caused by empty feature classes, incorrect work environments, or strange user input. Exception errors can be "trapped" with try-except statements. ...

The Fundamentals of Python

Image
We slithered right into Python this week by creating our own code (or "script") that incorporated many of the basic elements of coding. Through the use of lists, methods, and loops, we created a script that printed out the following: The first line is the output of selectively picking an element from an index (a numbered list), which in this case was our full name. We had Python select only the last element in the list and print the output. Next, we had to inspect a given piece of code and had to identify and correct the errors to produce a dice game.  Lastly, we were tasked with a multitask script. It had to first generate a randomly populated list of 20 integers between the numbers 0 and 10. Then it had to identify the number of times a selected integer was found within the list, print this information, and recreate the list without the chosen number. This was definitely the most challenging aspect of the module as it incorporated every skill learned this week. Structur...

Introduction to Python

Image
As an introduction to Python, which is a computing language that is embedded in ArcGIS Pro, we were tasked with creating a flow chart and pseudocode for converting radians into degrees. Flowcharts are a visual method of planning, which is an especially important process to complete before delving into complicated code. Flowchart created in iodraw.com The aim of this exercise was to introduce us to calling up IDLE and ArcGIS Notebooks. IDLE looks like the stereotypical coding interface with its intimating emptiness and blocky text; whereas Notebooks is nearly the opposite with its bright, white interface, menu options, and bubbly outlining. Both programs act as language interpreters for the Python coding language, converting user commands into binary which is then read and executed by the computer processing system.