Coastal Flooding & Storm Surge Analysis
As climate change continues to intensify storms and increase flooding, it is vital for communities and governments to prepare for inevitable storm damage. In this week's lab, we explored coastal flooding models and prepared our own storm surge analysis. Our study area was Mantoloking, New Jersey, a low-laying barrier island that suffered major damage from superstorm Sandy in 2012. More information about the storm can be found on New Jersey's Department of Environmental Protection.
Superstorm Sandy
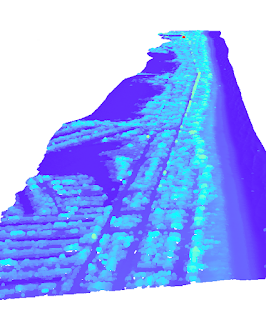
By comparing LiDAR data before and a few days after the storm, we can create a comparison analysis. The LiDAR data is converted into a DEM by first creating a TIN (triangulated irregulated network). As the TIN shows, the topography varies little with only very mild sloping.
LiDAR .las point cloud dataset is converted into a TIN
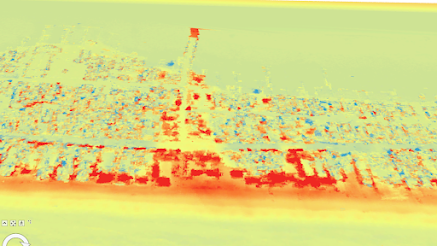
By subtracting the two DEMS, we can see the changes in the environment. Further color manipulation makes it clear where land has eroded or been built up (from possible storm debris and cleanup efforts). In the image below, the small blue spots indicate accretion, and the large swaths of red delineate areas of intense erosion.
Close-up scene of major erosion
The final map document displays the entire eastern coast, which has experienced erosion. Such analysis can assist in providing resources to the most impacted areas and prepare communities for future events.
Flood Zones in Collier County, Florida
We continued our flood analyses by comparing two datasets, one from USGS and one via LiDAR. We were tasked with compiling a table of the number of building structures that would be damaged within a one-meter storm surge. As each DEM created was slightly different, the number of buildings affected would also vary.
As the LiDAR had a horizontal resolution of 25 feet and the USGS-provided raster had a horizontal resolution of 100 feet, we can assume the LiDAR-collected raster more accurately captures the topography of the study area. We can then estimate errors of commission and omission. As seen from the resulting table, the number of structures affected varies drastically depending on the DEM.
Accurate datasets are vital in determining the number of people affected, which in turn affects the policies required for preparing for natural disasters. Policymakers, homeowners, emergency responders, and other stakeholders such as insurance companies rely on accurate and up-to-date information.
Local Governments and Mapping Floods
The links below are some helpful websites from either local governments, the US federal government, or private companies. Each one provides insights into different study areas, types of risks, and predictions for future events.


Comments
Post a Comment