Isarithmic Mapping
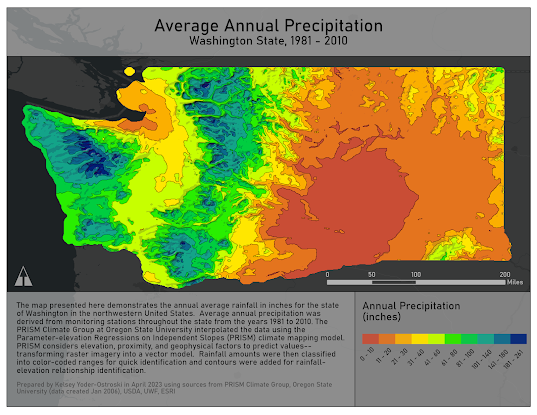
For this week's assignment, we learned about isarithmic mapping, which uses thematic symbology to depict continuous data. As it is impossible to make a record at every point across an enumeration unit, we can use interpolation to make educated predictions. This is commonly done for rainfall, temperature, or elevation by collecting data at control points (either true or conceptual) and then calculating the intermediary points using a method of interpolation. The mapmaker then uses the results, in combination with hypsometric or continuous tinting, to create a map that can help readers find values and patterns between the phenomenon and other geophysical features.


Comments
Post a Comment