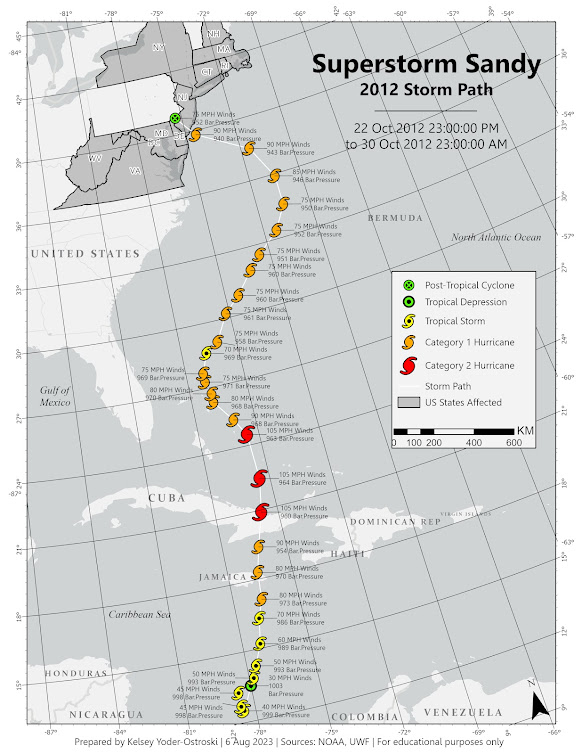
This week we continued exploring the aftermath of Hurricane Sandy by tracing its path in the Atlantic and inspecting just a small portion of the damage it caused.
By using NOAA data, we created a storm path map to illustrate Sandy's course as it began as a tropical depression, strengthened to a category 2 hurricane, and subsided into a post-tropical cyclone.
Next, we explored a small study area of 1 square mile off the coast of New Jersey and performed a damage assessment. Each property had to be identified and categorized using "domains". Each domain provides a dropdown menu of subtypes, which are pre-specified levels of damage. This is a useful tool for limiting the number of choices and reinforcing data integrity. Imagine telling a hundred people to describe thousands of buildings after a major storm. The responses would be wild!

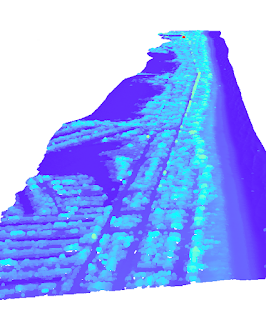
Overall, it is difficult to discern what damage has occurred and to what extent. A great deal of assumption was done on my part based on personal experience with hurricanes, strong winds, and flood damage. Even a small amount of flooding in a building can cause a total loss and roof damage from wind would not be obvious from the resolution provided. A LiDAR cloud dataset pre- and post-storm would have been helpful to complement the analysis as it could confirm the volume of erosion and accretion. Each point was symbolized by damage level and the final results were tabulated.
Post-Sandy satellite imagery (top) versus Pre Sandy (bottom)
Finally, a multi-ring buffer was created to discern any patterns between the distance to the pre-storm coastline and the damage level. There is a general pattern between distance and damage severity. However, there are other environmental factors that influence flood, wind, and debris damage. These include the structural properties of the building itself (concrete vs wood) and the structural integrity of the surrounding buildings. Additionally, other features such as roads, changes in elevation, and other water features (such as the sound to the west of the island) can change water flow velocity.


Comments
Post a Comment