The Perfect Projection
The Perfect Projection
Finding a solution to the persnickety problem of projections
The world is not flat.
Ok, maybe you already knew that. I think we all already know that (not looking at you, flat-earthers). So, if we all already know and understand that the world is round, why is mapmaking so vexing?
The problem is: the world IS round. Maybe you've already noticed but most maps are flat. They exist on paper, on cellphones, on the GPS of our cars, and sometimes on really cool scrolls an adventure unfurls dramatically before the big battle. Until we get bigger pockets, nobody will carry around a globe for quick reference.
The second problem is: the world IS NOT round. No, I am not conceding to the flat-earthers. The world is still a sphere but it's full of imperfections (aren't we all). There are mountains and oceans: gravity pulls and pushes the planet into an oblique spheroid.
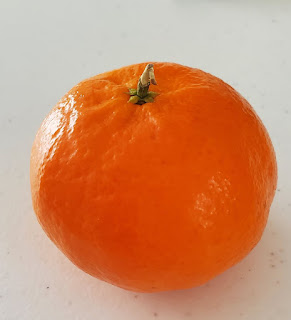
One of the most basic, yet most challenging, conundrum for mapmakers is to recreate the actual 3D world onto an artificial 2D map. A classic demonstration involves an orange. At first glance, it looks round, but on closer examination, we can see divots and that it's a little squashed towards the middle. We can use an orange as a stand-in for the planet Earth.
This representation works... for the moment. Remember we want something flat to represent the places around us. So let's try to unpeel our Earth's skin and see what happens.
Behold!
Oh boy, that's one strange looking.... thing. It definitely doesn't look like a map. Maps are rectangles! Maps are flat! Our orange peel map is strangely shaped. The skin is still popping up and is not entirely flat. Let's try again.
It's flatter now, but the edges are all torn up. The skin is still highly dimpled and everything got pushed together. This is a highly impractical map. Can you even tell it used to be spherical?
That's where projections come in
Thankfully much smarter people have been at work solving this problem. The solution is projections. Projections are a systematic approach to purposefully distorting the Earth so the new map retains some important information. This can be shape, area, distance, or direction (SADD). Different forms of measurement result in different outcomes. What projection type to use will be dependent on the area being studied and what information is being sought.
The three projection families are: planar, conic, and cylindrical.
- Planar- a flat piece of paper
- Conic- a piece of paper rolled into a cone
- Cylindrical- a piece of paper rolled into a cylinder
Each family provides a different way to measure. No one projection will be perfect for every point of the globe.
We can show how the chosen projection affects the map with the use of grids and graticules.
Grids are simple horizontal and vertical lines that are evenly spaced apart. If you have ever played Battleship, you've played with grids. These evenly spaced grids are a result of projection. The correct projection makes the studied area evenly spaced; it makes measuring shape, area, distance, and/or direction easier. Grids make locating things on the map simpler and more effective.
Graticules are similar to grids but show geographic coordinates. Remember the earth is round and bumpy. Lines of graticules show us the earth's latitude and longitude. If we didn't project the area, we would have to do all of our measurements while contending with the earth's uneven surface.
In this example of the state of Colorado, the study area is projected with the Universal Transversal Mercator zone 13 North (using the North American Datum of 1983). This projection works particularly well for this area. Colorado lies almost entirely within the narrow zone, allowing for little distortion in a large-scale (highly detailed) map. If we were looking at the northern, central, or southern portions of the state, we could use state plane projections.
Further Resources:


.jpg)


Comments
Post a Comment