Scale and Spatial Data Aggregation
Scale and Spatial Data Aggregation
Levels of Detail
In spatial data analysis, scale and data aggregation are critical factors that influence the outcome of geographic studies and decision-making processes. Both play a vital role in determining how geographic phenomena are recorded, represented, and understood.
Scale
Scale in the context of spatial data refers to spatial extent or the level of detail that geographic features are recorded and represented. Scale can be understood as the ratio of what is featured on the map and what occurs in the real world. It is impossible to record every microscopic detail of the land or every nuance of nominal study features. Spatial analysts must determine the level of data smoothing required for a project.
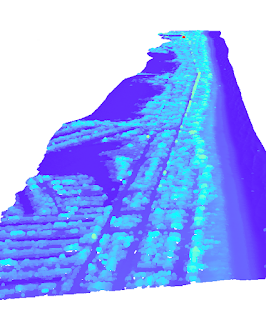
In geographic studies, as scale changes, so too do the features of the landscape. The simple map below records water features for the same study area and compares them at three levels of scale. As coarseness increases, smaller features are lost completely and boundaries are simplified. This results in shorter perimeters, simplified polygons, and larger surface areas. In DEMS we would see elevation smoothing and a decrease in average slope.

Spatial Data Aggregation
Every spatial analysis requires some level of data aggregation, which combines and summarizes data to make it manageable. However, every choice of scale and unit boundaries (zoning) results in the Modifiable Areal Unit Problem (MAUP). Analysis outcomes are dependent on scale and data aggregation. Statistical bias occurs every time spatial data is aggregated.
.png)

The same variables but aggregated in different ways results in different slope, intercept, r-value.
Gerrymandering
How a district is created impacts election outcomes. Designers must contend with not just geography but the vast array of demographic variables. Ideally, the district boundary encircles a singular area of interest. A perfectly circular boundary is considered optimally compact. In reality, we frequently see strange shapes. These seemingly arbitrary boundaries are potentially gerrymandering, which takes advantage of voting aggregation to result in biased elections. Using scores such as the Polsby-Popper Ratio can help us mathematically define the compactness of a district.

Though not circular, this district presents high compactness

A distinct with little compactness
Comments
Post a Comment